
In-stargazer: Helmet-mounted Camera System for Localization in Large-scale Industrial Environments
 ; Yun-Gu Won1, †
; Cheol-Su Kwag1
; Young-Min Moon2
; Ki-Hoon Kwon2
; Sung-Soo Hwang1, *
Copyright© ICROS 2026
Abstract
This study proposes an efficient localization system called In-Stargazer for human workers and mobile robots in large-scale industrial environments to enhance accident prevention and emergency response. Conventional methods suffer from technical limitations, high costs, and low practicality. To address these issues, the proposed system employs a lightweight helmet-mounted camera (120° FOV, 50 mm × 40 mm × 15 mm, 112 g), which can also be deployed on robot platforms. Unlike approaches using front-facing images that raise privacy concerns and are sensitive to environmental changes, the system relies solely on ceiling images, exploiting their structural stability in industrial settings. The environment is segmented into predefined sections, and a database is constructed for efficient image matching. To handle textureless ceilings, a deep learning-based feature extractor and matcher combined with a particle filter are used to improve robustness and accuracy. Experimental results show 81.9% pose estimation accuracy within one sub-section and 91.4% within two. This cost-effective and practical solution enables privacy-conscious localization and supports safe and efficient operation in industrial environments shared by humans and robots.
Keywords:
industrial environment localization, ceiling-image-based localization, monocular camera-based localization, helmet-mounted cameraI. INTRODUCTION
Developing a system to determine the location of not only human workers but also autonomous or semi-autonomous robots in large-scale industrial environments is essential to ensure operational safety and efficiency. As industrial sites increasingly adopt robotic systems to replace or assist human labor, accurate and reliable localization of both humans and robots has become a critical requirement. Previous studies have attempted to address this problem using various sensors such as RFID [1,2], WiFi [3,4], UWB [5], LiDAR [6–9], and cameras [10–14] in the field. RFID, WiFi, and UWB are radio wave-based technologies often used for real-time worker location tracking. However, their performance can be affected by environmental factors such as signal reflections from factory facilities, as well as dust, steam, or contamination that leads to inaccurate measurements. These technologies also face inherent limitations, including recognition and communication range constraints [1,15]. RFID requires pre-attaching tags to walls or facilities within the factory, and WiFi can cause compatibility issues with user devices, making field application challenging [1,15]. UWB can use the same frequency range as many other devices, causing interference between devices [5]. LiDAR technology allows precise distance measurements but has drawbacks such as limited detection range, high cost, and heavy weight for distribution to each individual, which limit its practicality [16].
On the other hand, Camera-based technologies show potential to overcome some of these limitations. Cameras are less affected by physical obstacles or distance constraints and can collect various visual information, making them useful even in complex environments [17]. In particular, unlike traditional wireless technologies, cameras have the advantage of covering large areas while being relatively low-cost [17]. Among existing researches, there have been attempts to estimate pose using mobile cameras, such as those in [13] and [14]. mobile cameras can collect images from various locations, offering cost efficiency and the ability to easily cover large areas. They can also be flexibly applied even in complex environments.
While camera-based methods demonstrate significant potential, they also come with challenges that need to be addressed. Accuracy in camera-based position estimation in factory environments faces significant challenges due to motion blur, low texture, changing environments, and varying lighting conditions [19,20]. Heavy or cumbersome equipment, such as wearable devices [13] or handheld smartphones [14], reduces worker comfort and operational efficiency. The uniform and textureless nature of factory interiors, with smooth surfaces, repetitive patterns, and single-colored walls, makes feature extraction and matching challenging, leading to inaccurate position estimation. In addition, when the camera is oriented forward, as in traditional methods, factory equipment, structural layouts, and workers’ faces may be captured in the images. This can lead to critical issues such as breaches of factory security or violations of workers’ privacy rights. Hence, we were compelled to adopt ceiling images.
There have been studies that explore the use of ceiling images for position estimation [23–26], but these face challenges in practical application. The types of sensors used, the availability of blueprints, and the varying ceiling structures across different factories and indoor spaces make it difficult to adapt these methods. These factors, combined with the diverse and complex layouts found in industrial settings, make the implementation of ceiling image-based localization systems more challenging in comparison to other approaches.
Given these limitations, this study adopts an alternative approach by dividing the factory space into predefined sections and performing location estimation through sub-section based matching using only a monocular ceiling-facing image. This method offers a more robust and practical solution by reducing the reliance on detailed maps or error-prone feature extraction, improving stability and scalability in industrial environments. To address challenges in equipment, security, privacy, and spatial constraints, we developed several technologies. First, for user convenience, we created a lightweight camera device that attaches to a safety helmet, allowing workers to maintain ease of movement without additional heavy equipment. Second, to ensure security and privacy, we enabled position estimation using ceiling-view images, which offer greater stability due to fewer changes and are less affected by structural modifications, thereby protecting worker privacy. Third, to enhance the stability and maintenance of position estimation, we divided the space into sections and sub-sections, created a corresponding database, and performed database-query matching using a learning-based feature extractor and matcher. Given the lack of features and similar patterns on ceilings, we limited the search range to nearby locations. Lastly, a developed PF (Particle Filter) was employed to stabilize the worker’s position estimation based on the matching results.
The structure of this paper is as follows. In section 2, we introduce studies similar to ours. In section 3, we explain the overall flow and algorithms of our system and describe the hardware we developed. In section 4, we explain the performance of our system by comparing it with existing studies. Finally, in section 5, we summarize the overall content and discuss future work.
II. RELATED WORK
1. Previous Research on Camera Placement and Orientation for Localization in Factories
Previous research has explored various camera placement options to improve the accuracy and usability of worker position estimation systems in factories. For example, [21] developed a system capable of real-time streaming by mounting a monocular camera on a worker’s helmet or safety glasses. However, the safety glasses weighed 312g, significantly increasing worker fatigue during prolonged use. [22] and [13] attached cameras to the back of workers’ safety vests for position estimation. [13] employed a monocular camera and an IMU-aided stereo camera, securely attaching them to the vest using a thick aluminum plate. While this configuration improved positional stability, the increased equipment weight compromised usability and worker convenience.
The orientation of the camera is another critical factor influencing the accuracy and practicality of localization systems in industrial environments. In [21], the camera was mounted on the front of the helmet or safety glasses, aligning with the worker’s field of view. This setup facilitated real-time observation but raised concerns about potential privacy violations of other workers and the exposure of sensitive equipment within secure facilities. In contrast, [22] and [13] adopted marker-based absolute positioning methods, with cameras facing downward to recognize floor-mounted markers. This downward-facing orientation enabled accurate worker position estimation but restricted the worker’s field of view and required a preparatory step of installing markers on the floor, which added complexity to the deployment process.
2. Previous Research on Image-Based Localization Challenges in Factories
Applying camera-based localization techniques in factory environments faces significant challenges due to the unique characteristics of industrial settings. Repetitive structures, frequent layout changes, and varying lighting conditions make it difficult for existing methods, such as SLAM (Simultaneous Localization and Mapping), VO (Visual Odometry), and VPR (Visual Place Recognition), to perform reliably. Additionally, research on ceiling images has revealed challenges specific to industrial applications.
Traditional localization methods, such as SLAM, VO, and VPR, face significant challenges in industrial settings. SLAM constructs maps and estimates positions but struggles with loop closure due to visually repetitive structures and frequent modifications in large-scale factories, leading to accumulated errors. VO, which estimates motion between frames without mapping, is computationally efficient but lacks error correction, causing accuracy degradation in low-texture or repetitive environments. Both methods suffer from instability in dynamic factory conditions where tracking loss is common. VPR, which relies on image matching with a pre-built database, is sensitive to viewpoint changes, lighting variations, and structural modifications. Learning-based VPR demands extensive training datasets, while non-learning approaches struggle in textureless or variable lighting conditions. These limitations undermine the reliability of traditional localization methods in industrial environments.
Ceiling images offer a stable and consistent basis for localization, as they are less affected by structural changes compared to walls or floors. Additionally, they enhance privacy by avoiding the capture of sensitive activities. Prior studies [23–26] explored ceiling-based localization but faced scalability and practicality issues. [23] employed pre-trained CNNs with remote-controlled robots for data collection, incurring high costs and inefficiencies, particularly in large-scale factories. Industrial settings with metallic structures also degraded laser-scanning accuracy due to reflections. The study’s small-scale environments (72m² and 83m², ceiling heights of 2.5m and 4m) further limited applicability. [24] utilized blueprints, but discrepancies from real-world layouts due to pipes and lighting fixtures reduced reliability. [25] focused on ceiling outline detection, which was hindered by uniform textures and obstructions, restricting its effectiveness in larger industrial spaces (tested in 2.5m × 5m areas). CV-SLAM [26] attempted natural landmark tracking but struggled with texture uniformity, structural modifications, and non-planar ceilings, increasing system maintenance complexity. In summary, previous ceiling-based localization approaches either rely on strong environmental assumptions (e.g., blueprints or distinctive ceiling structures), require costly data acquisition platforms, or have only been validated in small-scale environments. In contrast, our approach focuses on scalability and practicality in real industrial sites by combining section-based decomposition with lightweight wearable sensing.
III. PROPOSED SYSTEM
1. Overview
Fig. 1. shows the system flow from the offline to the online process based on a monocular camera only. In the offline process, a 360° camera scans the factory interior, capturing a single video stream. The relative positions of the videos are calculated using SFM (Structure From Motion), and only ceiling portions are cropped and stored in the database. In the online process, a helmet-mounted camera captures ceiling-view images. These images are matched with the database, and the worker’s position is estimated using a PF (Particle Filter).
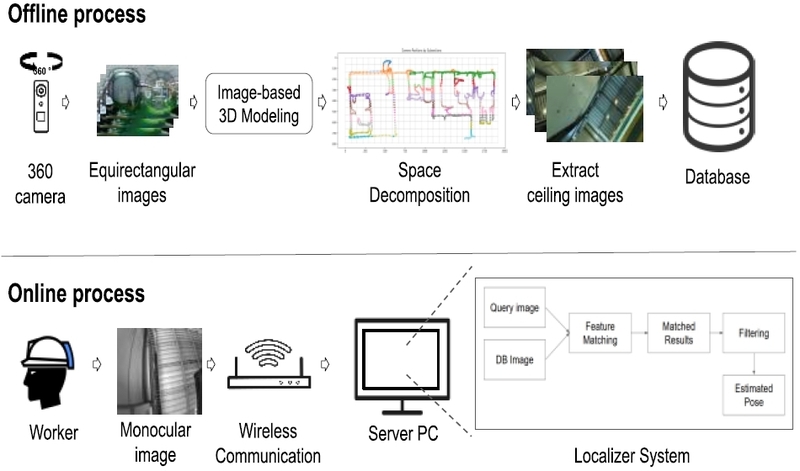
Scenario overview.
2. Design of a Helmet-Mounted Camera for Localization Systems
Fig. 2 is the device developed and used in this research. The monocular camera, along with the battery are housed and attached to the helmet. Once the main system is activated, the camera attached to the helmet captures an image in grayscale. This image is transmitted to the Matching System via Kafka, with a 10% compression applied for faster transmission. After compression, the image is converted into 64-bit binary data and sent using Kafka. For more details, refer to Table 1 for specifications.
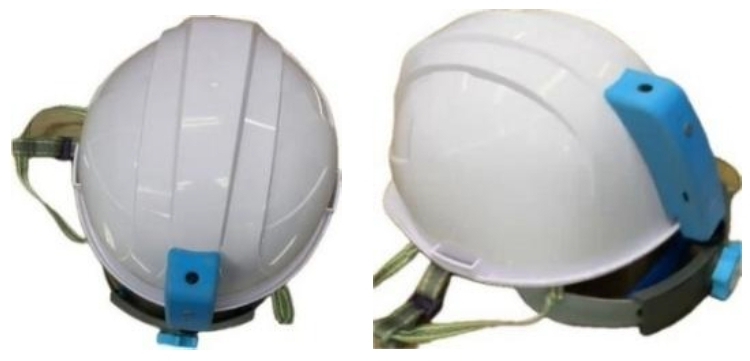
Developed helmet-mounted camera.

Specification & functions of developed camera.
The proposed camera system is designed to minimize user inconvenience during operation while ensuring workplace security and protecting worker privacy in industrial environments. By integrating the camera into the helmet without requiring additional accessories such as vests, the system enhances usability and eliminates potential issues associated with extra equipment. Additionally, its lightweight design further reduces user discomfort, facilitating seamless integration into daily operations. The camera’s ceiling-facing orientation mitigates security risks and safeguards worker privacy, effectively addressing concerns related to workplace surveillance and personal data protection.
3. Offline Process
The process involves dividing the given space into zones and determining the minimal positions where users can exist, as well as providing the necessary database (DB) for matching. To efficiently manage the entire space, we first establish the minimal range within which users can be located and divide the entire space into grids (sub-sections). These sub-sections serve as foundational data required for detailed spatial matching tasks. Subsequently, the entire space is further subdivided into larger sections to finalize a systematic setup that enhances the overall efficiency of the system. Space decomposition process is an essential step for recognizing the environment and perform matching tasks efficiently. The construction of the DB involves four steps: 360° Video Capture, 3D Model Creation, Space Decomposition, DB Generation.
First, a 360° camera is employed to capture video of the space in which location estimation is to be performed. This serves as the initial step for creating a subsequent 3D model and extracting ceiling view images to construct the DB (database). The reasons for using a 360° camera in this research are as follows. Due to constraints such as the size of the factory, operational status, and filming schedule, repetitive and prolonged capturing may be challenging. By utilizing a 360° camera, a greater amount of information can be efficiently collected within a shorter time frame. Ceiling view images alone are insufficient for creating a 3D model and determining the positions of the captured images.
Second, a 3D model is generated using 360° images and actual spatial data, with unnecessary outlier points removed. The positional information of images is then obtained within the model. As the model reflects real spatial data, it serves as a three-dimensional map, while its top view functions as a two-dimensional map.
Third, space decomposition is utilized to divide the environment into sections and sub-sections and to store relevant information for efficient position estimation. Before space decomposition, the area is divided into sections, and criteria for user location range are established. These criteria are based on a 2D map from the 3D model, defining grids (sub-sections) of size m × n meters. Each grid represents the minimal range where a user can be positioned.
The 2D map is divided into m × n grids, with each sub-section classified by its section. Each 360° image is assigned to a sub-section based on its location and stored accordingly. Ceiling portions of the images are cropped and saved in corresponding folders. Feature points are then extracted from each image and stored in the same folder. Fig. 3 illustrates an example of Space Decomposition. In the Figure, small squares mean sub-sections, and their set is separated by sections.
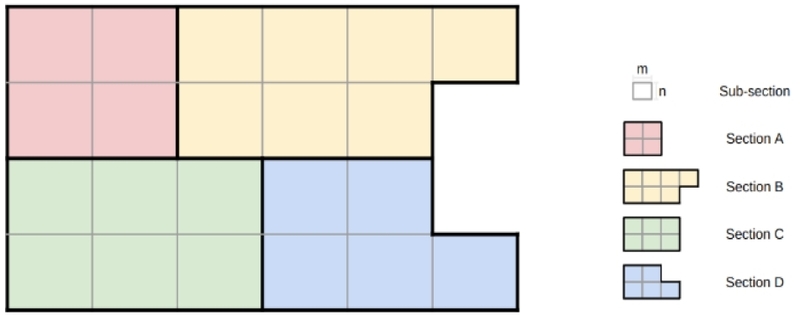
Example of space decomposition.
Lastly, all the information acquired thus far is stored in a single DB (database). In this study, MariaDB was utilized for database construction. The database consists of several tables: the Factory table, which stores the factory name and the size of all sub-sections; the Section table, which contains section information; the Space table, which holds space information; the SpacePose table, responsible for managing the location information of spaces on the 2D map; the Pose table, which stores information related to each image; the Feature table, which stores the paths to the feature files of each image; and the Marker table, which stores information about access markers.
4. Online Process
The main system performs image capture and pose estimation through communication between two components: 1) Matching System, and 2) Filtering System. For communication, the middleware Kafka is utilized to exchange and process information efficiently. The camera attached to the safety helmet captures an image and sends it to the Matching System. The Matching System then estimates the position using a deep learning-based feature extractor and matcher, and transmits the results to the Filtering System. The Filtering System uses this information to optimize the position through particle filter, and sends the optimized data to the system responsible for displaying the current information.
Fig. 4 presents an overview of the Matching System algorithm, which consists of three main stages: A) Feature Extraction and Matching, B) Fork Point Assignment, and C) Search Range Adjustment. When a query image 𝑄𝑡 is received, the system performs pre-processing prior to feature extraction of 𝑄𝑡. Specifically, it first checks the image quality (e.g., saturation, blur). It then verifies the camera ID and examines the image for markers. If a marker is detected, its position is retrieved from a pre-generated database and assigned as the previous position 𝑃𝑡−1. If no marker is found, the system uses the previously stored pose corresponding to the camera ID as 𝑃𝑡−1.
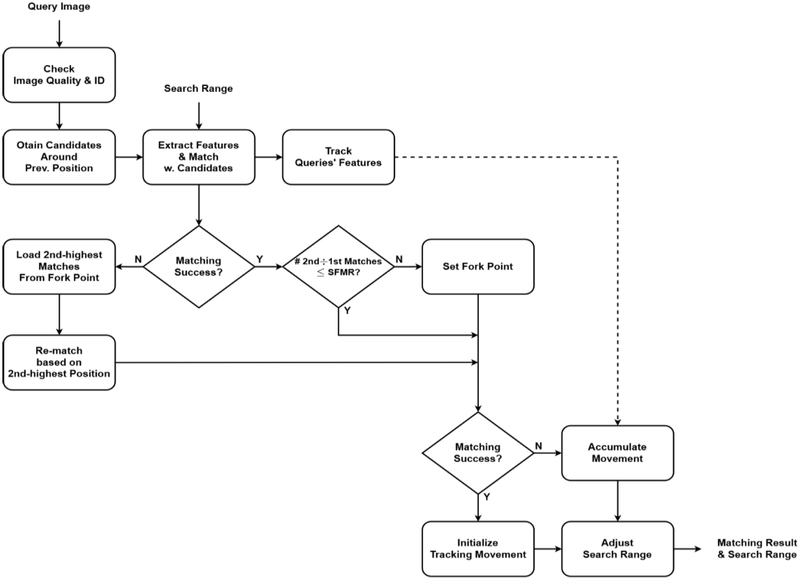
Matching system algorithm.
Next, deep learning-based feature points are extracted from the input image and matched against the pre-generated database to identify potential nearby positions. Subsequently, the system evaluates the success of the matching process and analyzes the number of matching pairs to designate a Fork Point. The Fork Point is defined as the ratio of the second-highest number of matching pairs to the highest (Second-to-First Matches Ratio, SFMR), where a higher value indicates a smaller difference between the two. That is, a smaller difference implies that the likelihoods of the probabilities of two positions are similar. In this explanation, Fork Point will be supposed as 𝑃𝑡−2. The system determines whether the matching process was successful and estimates the displacement between the previous query image 𝑄𝑡−1 and the current query image 𝑄𝑡 based on feature correspondences. This displacement is then utilized to dynamically adjust the subsequent search range. The search range becomes the range that determines the surrounding positions when the feature points are matched with the surrounding positions using the DB.
A) Feature Extraction and Matching
The algorithm identifies sub-sections surrounding 𝑃𝑡−1 by specifying a range 𝑟 (e.g. 𝑟 = 3, 5, 7 …) to define an 𝑟 × 𝑟 area centered on 𝑃𝑡−1. Feature point information for ceiling-view images within these sub-sections is retrieved from the database to generate matching candidates. At this, segmentation of positions and feature extraction for ceiling-view images are performed during the Offline Process, specifically in the Space Decomposition and Database Generation phases.
The candidate set is constructed, feature points are extracted from the current input image 𝑄𝑡, and image matching is performed between the received image and the candidates. If the number of matching pairs exceeds a predefined threshold, up to 𝑁 matches are stored in descending order of matching pairs. If no matches meet the threshold, the process is considered a matching failure.
B) Fork Point Assignment
If matching is successful, the system compares the highest and second highest number of matching pairs based on the SFMR (Second-to-First Matches Ratio). If the difference between these two numbers is not significant—that is, if it exceeds the SFMR threshold—the current position is designated as the Fork Point, and information about the matching results for nearby positions is stored. The reason for this approach is that matching results at the current position may be ambiguous. Therefore, if a future matching attempt fails, the system can determine that the previous Fork Point matching might have been inaccurate and reattempt matching from the Fork Point.
If matching fails, the algorithm employs the Fork Point to locate an earlier position, 𝑃𝑡−2. At 𝑃𝑡−2, the position with the highest number of matching pairs is , 1, that is 𝑃𝑡−1. Since the failure occurred when the previous position was , the position with the secondhighest number of matching pairs at 𝑃𝑡−2, , is assigned as the new 𝑃′𝑡−1. The algorithm then generates new matching candidates as before but excludes any overlapping positions between the prior 𝑃𝑡−1 and the new 𝑃′𝑡−1 to enhance computational efficiency. This exclusion is based on the assumption that these positions have already been deemed invalid when the previous position was 𝑃𝑡−1. This method is designed to efficiently overcome local minima within a short time frame. If the position candidates are determined, matching is attempted using the same method. If matching still fails, the previous position 𝑃𝑡−1 is assigned as the current position 𝑃𝑡.
C) Search Range Adjustment
Regardless of the initial or re-match attempt, if the match is successful, the algorithm determines the camera’s most probable position by summing the matching pairs within each sub-section, selecting the one with the highest sum as the current pose 𝑃𝑡. If matching is successful across consecutive frames, the system considers the position estimation stabilized. At this point, the search range 𝑟 and accumulated displacement are reset to their initial states, preventing unnecessary expansion of the search area and ensuring efficient, robust localization. If matching is successful only in the current frame, only the accumulated displacement is reset. Finally, to complete the pose estimation, the positional information of surrounding candidate locations and their matching pair counts are stored as the final result and transmitted to the Filtering System.
If all re-matching attempts fail, the position result from the previous frame is stored as the position result for the current frame. Then, the displacement is calculated through feature tracking between the previous query Qt-1 and the current query Qt. If failures occur consecutively, this displacement accumulates. When the accumulated displacement exceeds a specific threshold, the search range r is expanded. Finally, the results (position candidates and the corresponding number of matching pairs) are sent to the Filtering System to complete pose estimation for the current frame.
This research employs SuperPoint [27] for feature extraction and LightGlue [28] for feature matching, addressing the limitations of traditional methods. SuperPoint offers fast, robust extraction and is resilient to transformations such as rotation, scale, and lighting changes. LightGlue, developed as an extension of SuperGlue [29], improves matching flexibility and computational efficiency.
Additionally, to achieve better DB-Query matching results, we rotate the query image and perform matching with the database. This is because LightGlue may struggle with matching if the angular difference between the two images is large. Therefore, the input image is rotated to 0°, 90°, 180°, and 270°, and matching is performed with each candidate. This approach leads to an increase in both the number of matching pairs and the accuracy compared to the original method. The illustration for this is shown in Fig. 5. Matching Results According to Angle.
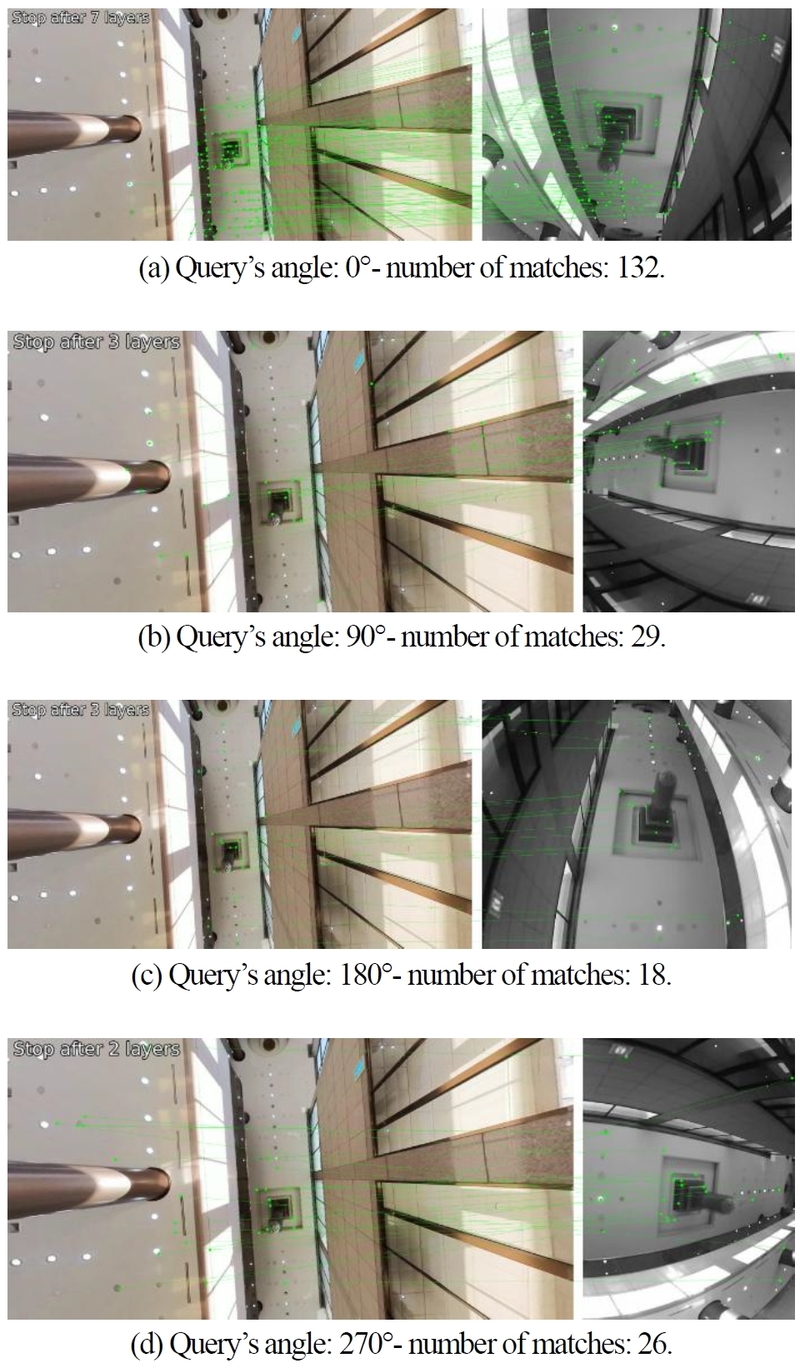
Matching results example according to angle.
Matching results often include outliers that degrade position estimation accuracy. To address this, we adopt a particle filter, suitable for nonlinear and non-Gaussian systems, and propose an enhanced weight update strategy leveraging Matching Accuracy, Distance, and Motion Vectors for robust estimation. The industrial environment is modeled as a structured grid, with each coordinate linked to a database landmark. Particles are distributed across this grid, and their likelihoods are updated based on spatial relationships with landmarks. A scale factor s is introduced to convert real-world displacement into grid units, ensuring compatibility within the particle filter framework.
A) Observations
The observations utilized in this study are defined as follows. Matching Accuracy represents the number of feature correspondences between the input image and database images, serving as an indicator of visual similarity. The number of matched feature points at each landmark reflects the likelihood that the corresponding location is the actual position. A higher number of matches means the landmark is more likely to represent the worker’s actual location.
Distance is defined as the euclidean distance between a particle and a landmark, providing a measure of spatial proximity. Particles closer to a given landmark are more likely to represent the actual position, making distance a critical factor in refining position estimates within the particle filter framework.
Motion Vector denotes the estimated displacement between consecutive frames, derived from the camera sensor mounted on the helmet. This vector provides an approximation of the worker’s movement; however, sensor noise and environmental variations introduce uncertainty. To mitigate these effects, the influence of the motion vector is adjusted accordingly to enhance the robustness of the estimation process.
B) Method for Updating Weights
This study presents a method for effectively integrating the aforementioned observations to enhance particle weight updates.
The Matching Accuracy Weight and the Distance Weight are combined to assess the reliability of each particle. Among these, the weight associated with Matching Accuracy, denoted as Wmatching,l is computed by normalizing the number of matched feature points at each landmark with respect to the total number of matches. The formula is as follows:
| (1) |
nummatchesl represents the number of matched feature points at landmark l, while L denotes the total number of landmarks. This weight serves as an indicator of the likelihood that a given landmark corresponds to the actual position, with a higher number of matches increasing the probability of accurate localization.
The weight associated with Distance, denoted as Wdistance,i,l is computed based on the euclidean distance dl,i between particle i and landmark l. A gaussian distribution is applied to model this relationship, ensuring that particles closer to a landmark receive higher weights. The formula is as follows:
| (2) |
zl represents the measured distance, while R denotes the standard deviation of the observation noise. The term N(zl |dl,i, R) refers to the probability density function of a gaussian distribution with a mean of zl and a standard deviation of R evaluated at dl,i. To refine the weight assignment, the Matching Accuracy Weight and Distance Weight are combined to compute the MatchingDistance-Based Weight, Wmatch-distance,i for each particle. The formula is as follows:
| (3) |
Multiplying the Matching Accuracy Weight and Distance Weight leverages the complementary strengths of visual similarity and spatial proximity in position estimation. While a landmark with many feature matches suggests high matching accuracy, and a short distance implies spatial closeness, each alone may not guarantee correctness. By combining the two, the system emphasizes particles that are both visually and spatially reliable, reducing the influence of low-confidence particles and enhancing robustness against noise.
The Motion Vector Weight evaluates whether a particle’s displacement aligns with the expected movement obtained from sensor data. Due to coordinate differences between the image and grid spaces, only the movement magnitude is considered. The expected distance dexpected is computed by scaling the motion vector using a factor s, ensuring compatibility between real-world and grid units. Each particle’s actual displacement dmotion,i is compared to this expected value, and a Gaussian distribution is applied to assign higher weights to particles with smaller deviations. The formulation is as follows:
| (4) |
R represents the standard deviation which quantifies the uncertainty in the observation of movement distance. The term N(dexpected | dmotion,i, R) refers to the probability density function value of dmotion,i in a gaussian distribution with a mean of dexpected and a standard deviation R.
The final weight Wi for each particle is computed by integrating the MatchingDistance-Based Weight and the Motion Vector Weight. The formula is presented below:
| (5) |
The final weight is computed by multiplying the Matching-Distance-Based Weight and the Motion Vector Weight. Motion vectors, obtained from helmet-mounted image sensors, are subject to sensor noise and environmental variations, which can cause uncertainties. By integrating all three weights, the influence of unreliable information sources is minimized, thereby mitigating errors caused by incorrect data. Particles that exhibit high matching accuracy, spatial proximity to landmarks, and consistency with motion information are assigned higher weights, enhancing the accuracy of position estimation. Conversely, particles with low reliability have minimal impact on the final position estimation, contributing to the overall robustness of the system.
IV. EXPERIMENTS
1. Setting And Explanation of Experiments
The specifications of the computer used for our experiments are as follows: CPU - Intel i7-6900K, GPU - NVIDIA RTX 4090 with 24GB VRAM, and RAM - 64GB. The experiments are conducted on the Ubuntu 20.04.6 LTS operating system.
In Offline Process, our program requires the creation of a 3D model. While there are various photogrammetry techniques for generating 3D models, we use the SFM (Structure From Motion) [30] technology to create a 3D point cloud, which is then used to generate the 3D model using Agisoft’s Metashape software (https://www.agisoft.com).
Furthermore, to evaluate the performance of our system in the Online Process, we conducted three types of experiments. We conducted an experiment to check the accuracy of our system, and compared our system’s performance with other studies. Also, we conducted an experiment to compare the results when using only the Matching System versus when incorporating the Filtering System.
In these experiments, we established two evaluation criteria for performance verification and comparison: the failure rate of pose estimation and the accuracy. The failure rate of pose estimation measures the proportion of Query images for which pose estimation was successful. It does not necessarily indicate whether the location was estimated correctly. Accuracy evaluates how precisely the pose was estimated at the section and sub-section level. This is determined by assessing the matching accuracy between the DB images of a section or sub-section and the corresponding Query frames.
To evaluate and compare the performance of our system, we conducted comparative experiments using VO (Visual Odometry) and SLAM (Simultaneous Localization and Mapping) research for image-based pose estimation. For VO, we used the deep learning-based location estimation method DPVO [31], and for SLAM, we employed the Stella VSLAM [32], which can utilize 360° panoramic images. During the comparison, VO was observed to lack an error correction mechanism for accumulated errors, and since it outputs results in a different coordinate system from ours, we adjusted the scale of the VO trajectory to match that of our system to assess accuracy.
The dataset used in our experiments is as follows. The experimental dataset consists of images captured directly from the factory, with Fig. 6. DB Images and Query Images showing examples of DB and query images used during the operation of the main system. We have three experimental datasets, which are described below. The shooting time and distance at which the datasets were captured are estimates. The total area of the space is 780m × 300m, which is divided into sub-sections of 3m × 2.5m, resulting in a total matrix of 12 × 26. Please refer to Table 2 for a more detailed explanation of the dataset.
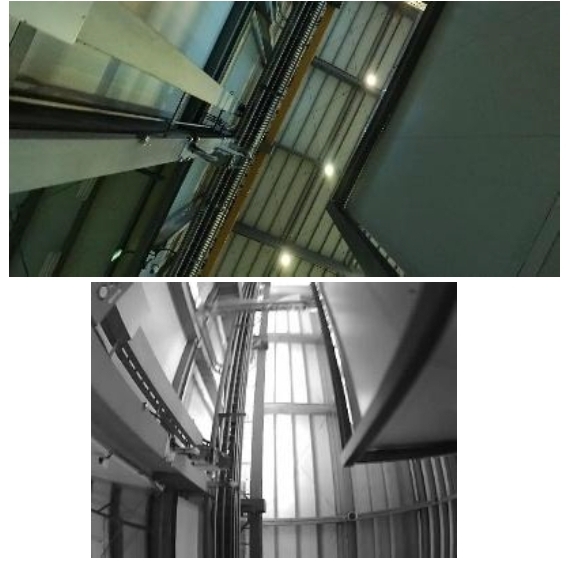
Ceiling-view DB image(L) and Query image(R).
Dataset Information.
2. Result
Experimental results using VO are shown in Fig. 7. (a)-(c) illustrate VO alone, where trajectories are poorly estimated or suffer from significant error accumulation, making interpretation difficult. (d)-(f) present results after scale and direction alignment using evo (https://github.com/MichaelGrupp/evo). Despite this adjustment, the Predicted Line (Color, VO Result) still deviates in direction or fails to align with the Reference Line (Gray).
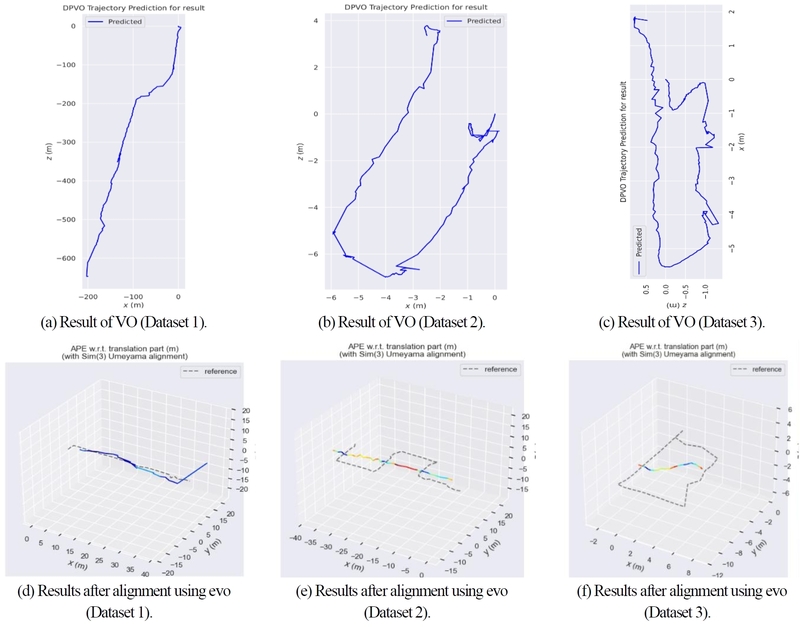
VO Result.
Stella VSLAM failed to achieve successful pose estimation. Despite attempts to create a map using 360° panoramic images and run the system with our camera’s images, pose estimation did not succeed. Analysis revealed that Stella VSLAM, which relies on the hand-crafted ORB feature, struggled to match images from different cameras, leading to failure. Using only the ceiling portion of the 360° images for mapping was also infeasible due to calibration constraints.
However, unlike other research, our method successfully estimated the position. In Table 3, the experimental results for section-level and sub-section-level evaluations conducted in the target factory are as follows. The probability of identifying the section where the user is currently located was approximately 88.2% on average. This result is attributed to the fact that the Filtering System does not immediately update the location based on the results from the Matching System. Consequently, sections that overlap during transitions contributed to this outcome.
Performance of the proposed method.
The Matching System provides the Filtering System with probability data across multiple candidate positions rather than a single best match, considering matching accuracy. Consequently, pinpointing the user’s exact location with 100% accuracy is challenging. Instead of instantly selecting the most probable location, the Filtering System gradually updates the position based on probabilities from other candidates. This approach may introduce slight delays between the actual and estimated positions, also affecting section determination when transitioning across boundaries.
This effect also influences pose estimation at the sub-section level. The probability of the estimated location exactly matching the user’s actual position averages 47.8%. However, considering the progressive updates of the system, the accuracy significantly improves when including cases with a one or more sub-section difference. Specifically, when accounting for both exact matches and one-sub-section differences, the location estimation accuracy reaches approximately 81.9%. Extending this to include up to two-sub-section differences further increases the accuracy to 91.4%.
Additionally, we compared localization results using only the Matching System versus combining it with the Filtering System. As shown in Table 4, incorporating the Filtering System improved the probability of correctly identifying the exact sub-section by approximately 7.3%. The probability of a one-sub-section difference remained similar or slightly increased, while the average error was comparable or slightly reduced. Despite the delay introduced by the Filtering System, it enhanced localization accuracy, leading to its integration for more reliable results.
Comparison of performance with or without filtering system.
V. CONCLUSION
This paper demonstrated that reliable localization in large-scale industrial environments can be achieved without SLAM or detailed map by leveraging ceiling-view images, section-based decomposition, and probabilistic filtering. By addressing the limitations of conventional radio- and LiDAR-based localization methods, the proposed system demonstrated that accurate and robust pose estimation can be achieved using cost-effective, lightweight camera modules combined with 360° imagery and 3D spatial models. The integration of a Matching System based on SuperPoint, LightGlue, Fork Point, and adaptive search ranges, together with a Filtering System employing a particle filter, enabled reliable position refinement under complex factory conditions. Experimental results in real factory environments confirmed the effectiveness of the approach, achieving 88.2% correct section identification and up to 91.4% localization accuracy within two sub-sections. Furthermore, the proposed framework supports privacy-conscious localization and is readily deployable on both human-mounted and robot-mounted camera platforms, making it well suited for human–robot shared industrial spaces. Future work will focus on improving real-time performance beyond 1 FPS and extending the system to support large-scale multi-user and multi-robot scenarios.
Acknowledgments
This research was supported by the Research Institute of Industrial Science & Technology (RIST) (No.2023H015).
REFERENCES
-
Q. Ma, X, Li, G. Li, B. Ning, M. Bai, and X. Wang, “MRLIHT: Mobile RFID-based localization for indoor human tracking,” Sensors, vol. 20, no. 6, pp. 1711, 2020.
[https://doi.org/10.3390/s20061711]

-
Y. Zhang, X, Gong, K. Liu, and S. Zhang, “Localization and tracking of an indoor autonomous vehicle based on the phase difference of passive UHF RFID signals,” Sensors, vol. 21, no. 9, pp. 3286, 2021.
[https://doi.org/10.3390/s21093286]
-
G. Huang, Z. Hu, J. Wu, H. Xiao, and F. Zhang, “WiFi and vision-integrated fingerprint for smartphone-based self-localization in public indoor scenes,” IEEE Internet of Things Journal, vol. 7, no. 8, pp. 6748–6761, 2020.
[https://doi.org/10.1109/JIOT.2020.2974928]
-
M. Zhang, J. Jia, J, Chen, Y. Deng, X. Wang, and A. Aghvami, “Indoor localization fusing WiFi with smartphone inertial sensors using LSTM networks,” IEEE Internet of Things Journal, vol. 8, no. 17, pp. 13608–13623, 2021.
[https://doi.org/10.1109/JIOT.2021.3067515]
- C. Zheng, Y. Ge, and A. Guo, “Ultra-wideband technology: Characteristics, applications and challenges,” arXiv, preprint, arXiv:2307.13066, , 2023.
-
A. Yilmaz, E. Sumer, and H. Temeltas, “A precise scan matching based localization method for an autonomously guided vehicle in smart factories,” Robotics and Computer-Integrated Manufacturing, vol. 75, pp. 102302, 2022.
[https://doi.org/10.1016/j.rcim.2021.102302]
-
Y. H. Huang and C. T. Lin, “Indoor localization method for a mobile robot using LiDAR and a dual AprilTag,” Electronics, vol. 12, no. 4, pp. 1023, 2023.
[https://doi.org/10.3390/electronics12041023]
-
J. Palacin, D. Martinez, E. Rubies, and E. Clotet, “Mobile robot Self-Localization with 2D push-broom LIDAR in a 2D map,” Sensors, vol. 20, no. 9, pp. 2500, 2020.
[https://doi.org/10.3390/s20092500]
-
Y.I. Yoon, H.S. Suh, G.J. Shin, and J.W. Lim, “Development of video stabilization technology in extreme environments using lidar-inertial odometry,” Journal of Institute of Control, Robotics and Systems (in Korean), vol. 31, no. 1, pp. 61-67, 2025.
[https://doi.org/10.5302/J.ICROS.2025.24.0244]
-
H. Hattori, N. Lee, V. N. Boddeti, F. Beainy, K. M. Kitani, and T. Kanade, “Synthesizing a scene-specific pedestrian detector and pose estimator for static video surveillance,” International Journal of Computer Vision, vol. 126, no. 9, 2018.
[https://doi.org/10.1007/s11263-018-1077-3]
-
L. Yang, L. Li, X. Xin, Y. Sun, Q. Song, and W. Wang, “Large-scale person detection and localization using overhead fisheye cameras,” 2023 IEEE/CVF International Conference on Computer Vision, pp. 19961–19971, 2023.
[https://doi.org/10.1109/ICCV51070.2023.01827]
-
M. W. Park and I. Brilakis, “Continuous localization of construction workers via integration of detection and tracking,” Automation in Construction, vol. 72, pp. 129–142, 2016.
[https://doi.org/10.1016/j.autcon.2016.08.039]
-
G. Popovi´c, I. Cviˇsi´c, G. Ecorchard, I. Markovi´c, L. Pˇreuˇcil, and I. Petrovi´c, “Human ´ localization in robotized warehouses based on stereo odometry and ground-marker fusion,” Robotics and computer-integrated manufacturing, vol. 73, pp. 102241, 2022.
[https://doi.org/10.1016/j.rcim.2021.102241]
-
Y. Feng and M. Golparvar-Fard, “Image-based localization for facilitating construction field reporting on mobile devices,” Advances in Informatics and Computing in Civil and Construction Engineering, pp. 585–592, 2019.
[https://doi.org/10.1007/978-3-030-00220-6_70]
-
F. Liu, J. Liu, Y. Yin, W. Wang, D. Hu, P. Chen, and Q. Niu, “Survey on WiFi-based indoor positioning techniques,” IET Communications, vol. 14, no. 9, pp. 1372–1383, 2020.
[https://doi.org/10.1049/iet-com.2019.1059]
-
W. Yang, Z. Gong, B. Huang, and X. Hong, “Lidar with velocity: correcting moving objects point cloud distortion from oscillating scanning lidars by fusion with camera,” IEEE Robotics and Automation Letters, vol. 7, no. 3, pp. 8241–8248, 2022.
[https://doi.org/10.1109/LRA.2022.3187506]
-
W. Chen, G. Shang, A. Ji, C. Zhou, X. Wang, C. Xu, Z. Li, and K. Hu, “An overview on visual SLAM: From tradition to semantic,” Remote Sensing, vol. 14, no. 13, pp. 3010, 2022.
[https://doi.org/10.3390/rs14133010]
-
A. Morar, A. Moldoveanu, I. Mocanu, F. Moldoveanu, I. Radoi, V. Asavei, A. Gradinaru, and A. Butean, “A comprehensive survey of indoor localization methods based on computer vision,” Sensors, vol. 20, no. 9, pp. 2641, 2020.
[https://doi.org/10.3390/s20092641]
-
M. Bujanca, X. Shi, M. Spear, P. Zhao, B. Lennox, and M. Luj´an, “Robust slam systems: Are we there yet?,” 2021 IEEE/RSJ International Conference on Intelligent Robots and Systems, pp. 5320-5327, 2021.
[https://doi.org/10.1109/IROS51168.2021.9636814]
- S.H. Park, H. Y. Lee, and C.G. Park, “Robust pedestrian dead-reckoning-aided monocular visual-inertial odometry under vision-degraded conditions,” Journal of Institute of Control, Robotics and Systems (in Korean), pp. 491-492, 2025.
-
I. Jeelani, K. Asadi, H. Ramshankar, K. Han, and A. Albert, “Real-time vision-based worker localization & hazard detection for construction,” Automation in Construction, vol. 121, pp. 103448, 2021.
[https://doi.org/10.1016/j.autcon.2020.103448]
- G. Ecorchard, K Koˇsnar, and L Pˇreuˇcil, “Wearable camera-based human absolute localization in large warehouses,” Twelfth International Conference on Machine Vision, vol. 11433, pp 754-761, 2019.
-
P. Scales, M. Rimel, and O. Aycard, “Visual-based global localization from ceiling images using convolution neural networks,” 16th International Conference on Computer Vision Theory and Applications, pp. 927–934, 2021.
[https://doi.org/10.5220/0010248409270934]
-
A. Ribacki, V. A. Jorge, M. Mantelli, R. Maffei, and E. Prestes, “Vision-based global localization using ceiling space density,” 2018 IEEE International Conference on Robotics and Automation, pp. 3502–3507, 2018.
[https://doi.org/10.1109/ICRA.2018.8460515]
-
Y. G. Kim and T. H. Park, “Localization of mobile robots from full detection of ceiling outlines,” 2016 IEEE International Conference on Information and Automation, pp. 1515–1520, 2016.
[https://doi.org/10.1109/ICInfA.2016.7832059]
- W. Y. Jeong and K. M. Lee, “CV-SLAM: A new ceiling vision-based SLAM technique,” 2005 IEEE/RSJ International Conference on Intelligent Robots and Systems, pp. 3195-3200, 2005.
-
D. DeTone, T. Malisiewicz, and A. Rabinovich, “Superpoint: Self-supervised interest point detection and description,” 2018 IEEE/CVF International Conference on Computer Vision, pp. 224–236, 2018.
[https://doi.org/10.1109/CVPRW.2018.00060]
-
P. Lindenberger, P. E. Sarlin, and M. Pollefeys, “Lightglue: Local feature matching at light speed,” 2023 IEEE/CVF International Conference on Computer Vision, pp. 17627–17638, 2023.
[https://doi.org/10.1109/ICCV51070.2023.01616]
-
P. E. Sarlin, D. DeTone, T. Malisiewicz, and A. Rabinovich, “Superglue: Learning feature matching with graph neural networks,” 2020 IEEE/CVF International Conference on Computer Vision, pp. 4938–4947, 2020.
[https://doi.org/10.1109/CVPR42600.2020.00499]
-
J. L. Schonberger and J. M. Frahm, “Structure-from-motion revisited,” 2016 IEEE/CVF International Conference on Computer Vision, pp. 4104–4113, 2016.
[https://doi.org/10.1109/CVPR.2016.445]
-
Z. Teed, L. Lipson and J. Deng, “Deep patch visual odometry,” Advances in Neural Information Processing Systems, vol. 36, pp. 39033–39051, 2023.
[https://doi.org/10.52202/075280-1696]
-
S. Sumikura, M. Shibuya, and K. Sakurada, “OpenVSLAM: A versatile visual SLAM framework,” Proceedings of the 27th ACM international conference on multimedia, pp. 2292-2295, 2019.
[https://doi.org/10.1145/3343031.3350539]

received his B.S. degree in Artificial Intelligence, Computer Science, and Electronic Engineering from Handong Global University, Pohang, South Korea, in 2023. He received his M.S. degree in Computer Vision in 2025. His research interests include SLAM, robotics, and visual localization.

received his B.S. degree in Artificial Intelligence, Computer Science and Electronic Engineering from Handong Global University, Pohang, South Korea, in 2023. He received his M.S. degree in Computer Vision in 2025. His research interests include SLAM, robotics, and visual localization.

received his B.S. degree in Artificial Intelligence, Computer Science from Handong Global University, Pohang, South Korea, in 2023. He received his M.S. degree in Computer Vision in 2025. His research interests include Neural Rendering, 3D Reconstruction, and Digital Twins.

received his B.S. degree in Computer Science and Electrical Engineering from Handong Global University, Pohang, South Korea, in 2008 and M.S. and Ph.D degrees in Electrical Engineering from Korea Advanced Institute of Science and Technology (KAIST), Daejeon, South Korea, in 2010 and 2015, respectively. He is currently working as an associate professor with the School of Computer Science and Electrical Engineering, Handong Global University, South Korea. His current research interests include Visual SLAM and Neural Rendering based 3D Reconstruction.